
Institutional investors still anchor macro trading decisions to government economic releases. But the data infrastructure behind those releases is eroding. For example, the US Bureau of Labor Statistics, which runs the surveys underpinning some of the most market-moving numbers in the world, has seen the response rate on its Job-openings and Labor Turnover (JOLTS survey) fall to roughly 30 percent. As response rates decline, the statistical precision of the estimates degrades.
This is not a temporary data collection issue. It is a structural shift playing out across developed economies, and it was the central theme of the opening keynote at the recent A-Team/Eagle Alpha Alternative Data Conference in New York, delivered by Apurv Jain, founder and CEO of MacroXStudio. The Fed’s nowcasting models – Atlanta, New York, Chicago – are sophisticated, Jain argued, but they cannot fix the quality of the inputs they depend on. “It’s not a question of having more PhDs who can make a better Kalman filter driven model. If the ingredients are bad, the dish is going to be bad.”
A Need for Better Macro Infrastructure
What is emerging, however, is not just a better forecasting technique, but the need for a new data infrastructure layer. As the quality of traditional inputs declines, institutions are increasingly faced with the same choice: build complex, multi-source systems internally, or rely on standardized external measurement systems designed for real-time use.
Jain, a former researcher at Bridgewater, and data scientist at Microsoft, who spent years building out alternative data capabilities inside the technology sector before founding MacroXStudio, has built a platform around a specific thesis: that no single alternative data source can replace government statistics, but a multimodal combination of many sources – systematically cross-referenced and mapped to specific economic releases – can do considerably better. In conversation with Market & Alt Data Insight, he walks through the evidence.
A thousand pipelines, six standard categories
MacroXStudio organises its data into six broad categories: sensor (traffic, foot traffic, shipping), satellite (night lights, emissions, physical activity), corporate (earnings, filings, business sentiment), social (search trends, microblogs, consumer sentiment), news (media coverage across languages and geographies), and micro (credit card transactions, payment platforms, app data). Within each category sit roughly 150 individual data-to-signal pipelines – almost a thousand in total.
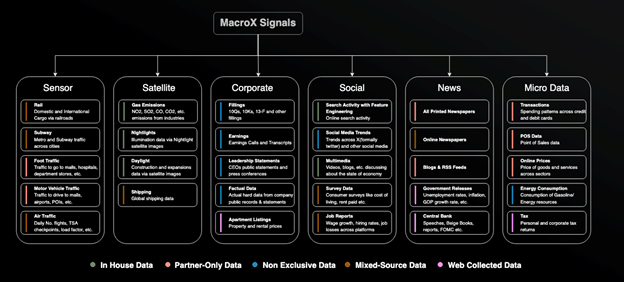
Fig 1: The MacroX Multimodal AI engines consumes many data sources with ~ 1000 data to signal pipelines, but organizes them into 6 major categories that are consistent across 14 countries.
The logic of the multimodal approach is that each category carries its own biases. Credit card data has panel drift and geographic skew. Satellite imagery is affected by cloud cover and seasonal variation. Search data reflects intent, not action. Any single source can mislead. The value, Jain argues, is in the combination: when multiple independent categories converge on the same signal, the probability of a systematic error drops substantially. When they diverge, that itself is information.
“Government data is essentially just one survey,” says Jain. “We think you need, at the very least, six large categories. A statistical agency working with one or two sources is batting with a sixth of the ingredients required.”
MacroX’s thesis is that constructing macro data this way – across multiple independent domains, mapped consistently, and updated continuously – will become a standardised measurement system rather than a collection of indicators. This standardisation will drive easier consumption of macro data by human PMs, quant models, and AI agents.
When labour and the economy stopped meaning the same thing
The strongest evidence for the multimodal approach comes from what happened to macro consensus after Covid. Before the pandemic, labour market indicators and broader economic activity moved broadly in line. Non-farm payrolls – fast, early in the month, and central to the Fed’s mandate – functioned as a reliable proxy for economic health. PMI – detailed surveys of private company activity – enhanced the picture.
Indeed, most macroeconomists had a standard set of tools with Non-Farm Payrolls and PMIs being early and reliable indicators for growth, and forecasting variables like the slope of the yield for assessing recession risk.
Covid broke that relationship. In the recovery, demand for workers surged and wage pressures grew sharply as compared to the overall economy. Workers had bargaining power. They could demand bonuses, switch jobs, push for better terms. Employers and purchasing managers, meanwhile, were paying more and reporting deteriorating conditions.
PMI surveys, because they poll purchasing managers – closer to corporate leaders rather than workers – seem to have captured C-suite pessimism driven by rising labour costs. The result was that through 2022 and into 2023 – with yield curves inverted and PMIs below trend – consensus settled firmly on an imminent recession with some such as Anna Wong at Bloomberg calling it a “100% Chance of Recession.”
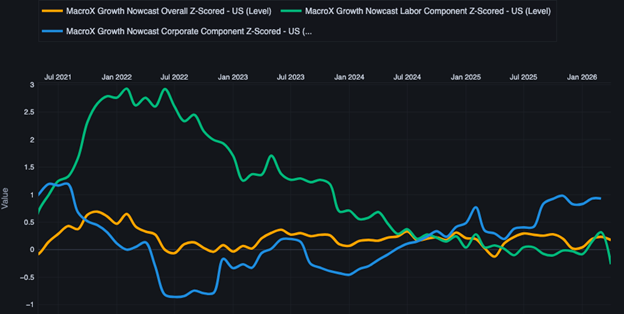
Fig 2: MacroX Overall Nowcast (Gold) is comprised of 6 sub-nowcasts (all not shown for clarity) including the corporate sub-nowcast component (blue) being quite pessimistic and the labor sub-nowcast (green) being quite optimistic in 2022 and 2023. The overall nowcast- more balanced than any individual one was not negative and hence nowcasted no recession in 2023.
MacroXStudio’s data by contrast called it differently. “We came out and said: no recession,” says Jain, and indeed there wasn’t. The platform’s approach – combining nine labour market indicators including unemployment, vacancies, wages, jobless claims, and quit rates, and constructing them from alternative data around the fundamental dynamic of worker versus employer bargaining power – allowed it to see that deteriorating corporate sentiment no longer signalled general economic weakness due to the strength of the labour market.
An added benefit was MacroX’s indicators were not whipsawed by the large revisions to Non-Farm Payrolls that culminated in President Trump firing the head of the US Bureau of Labor Statistics (BLS).
The PMI bias point is particularly striking. If PMI surveys systematically over-weight manager perception at times when employers are under wage pressure and enduring supply shocks, they produce a structurally pessimistic reading that does not reflect actual economic conditions. Jain argues this is exactly what happened: “The leaders were saying things were awful because they had to pay more, facing supply shocks, and couldn’t find workers. But workers were more optimistic, and they turned out to be right.”
MacroXStudio builds its labour market picture from many sources such as tweets, search data, corporate data (such as job postings, corporate actions and releases, news articles, and microblogs) with millions of data points captured continuously, rather than from survey responses that trickle in over weeks. “You can’t get there with a survey as easily,” says Jain. “They survey a few people. We’re looking at all tweets, all searches, corporate data, all news articles, instantaneously and across the board.”
Inflation expectations in real time
The same multimodal logic applies to the platform’s inflation work, which has taken on particular relevance in the current environment of tariff-driven supply shocks and geopolitical disruption.
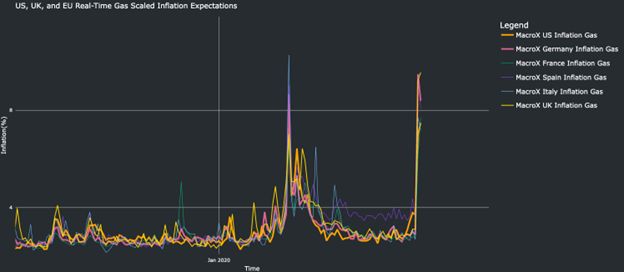
Fig 3: MacroX’s real-time measure of gas or fuel-related inflation concerns is high.
Official inflation expectations data arrives roughly six weeks after the fact – April releases cover March, for example. MacroXStudio measures inflation expectations in real time and, critically, separates them into two components: general inflation concern and energy-related concern.
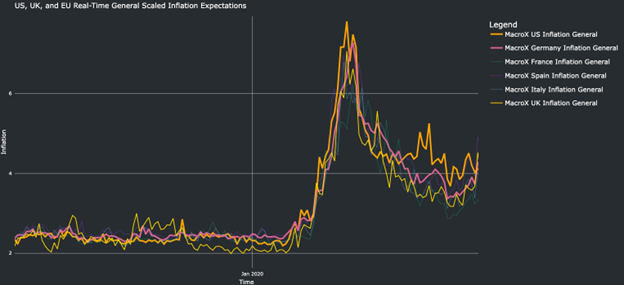
Fig 4: However, thus far effect on overall inflation expectations is more modest with only the UK (yellow line) ticking up the most.
This separation matters because it speaks directly to the question of central bank credibility, one of only two reasons, in Jain’s framework, that a central bank would hike rates. The other is a demand shock, and the current disruptions – tariffs, the Strait of Hormuz – are supply shocks, not demand shocks. The credibility question therefore turns on whether inflation expectations are becoming unanchored.
Jain cites a recent example. When UK rate markets moved from pricing in cuts to pricing in two and a half hikes, MacroXStudio published analysis arguing the move was unjustified. “We were very sure, based on our data, that it didn’t make sense for the UK to have two and a half hikes priced in,” he says. The pricing subsequently corrected.
Institutional Work Flows: The compliance picture
For institutional data buyers evaluating a multimodal macro platform, the compliance pathway is a practical consideration. Jain identifies four pillars that compliance teams typically assess: data provenance (where the data comes from and whether sources are reputable), the delivery channel (MacroXStudio is primarily web-based, which tends to simplify matters), AI usage (the platform does not train on client responses or prompts), and the macro-versus-micro distinction. Because the platform produces macro indicators rather than company-level signals, the material non-public information risk that dominates alternative data compliance is structurally lower.
“Compliance loves us,” says Jain, “but it takes longer than 30 minutes.”
Not just faster – better
The traditional alternative data value proposition has been timeliness: get ahead of official releases by using faster, higher-frequency inputs. Jain argues that the next generation of macro data changes the terms of that trade-off. Previously, being ahead of consensus meant knowing less, picking one leading indicator and putting disproportionate weight on it. The bet was that speed compensated for narrowness.
“This is why the next generation is different,” he says. “We’re not only ahead, but we have better data quality, more data, and greater timeliness. It’s just better across the board.”
That is, ultimately, a claim that institutional buyers will evaluate against their own track records and workflows. But the structural argument underneath it – that government macro statistics are degrading, that single-source alternative data carries its own biases, and that the real opportunity lies in combining sources systematically at scale – is one that the industry will need to reckon with regardless of which platform delivers on it.
If that argument holds, the next phase of macro investing may not be defined by not only the fastest indicators, but by which systems become the default, machine-readable representation of economic activity. In that world, macro data is no longer just an input. It becomes infrastructure.
Subscribe to our newsletter