


By Charlie Brown, former head of Head of IPV at Lloyds Banking Group, now Head of Market & Risk Solutions at GoldenSource.
The recent market volatility has emphasized the need for transparency in the processes that generate the profit and loss (P&L) and capital charges that impact bank balance sheets. In particular there is increased scrutiny around the inputs, processes and outputs generated by quantitative models that are used to generate fair values and associated daily P&L figures, as well as generate the P&L vectors used in internal models for market risk management.
The inputs, processes and outputs used to generate P&L can be thought of as modeling ecosystems. Modeling ecosystems can in turn be broken into two separate sub-categories. Firstly, trading and quantitative modeling ecosystems that calculate fair values of derivative and other held-for-trading positions. Secondly, a modeling ecosystem used for risk and finance control and regulatory calculations.
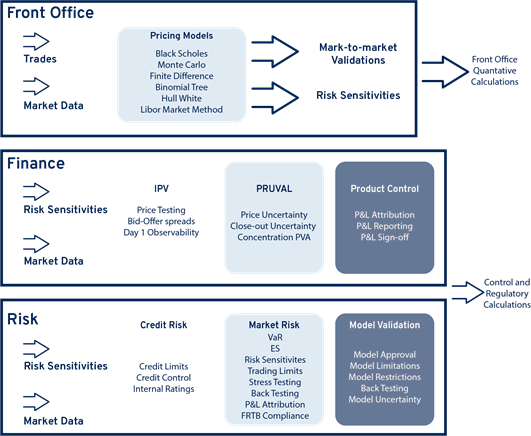
Front Office Modeling Ecosystems use quantitative models to calculate the fair values of derivative and other held-for-trading positions. They are either developed in-house by the bank’s quantitative research development team or they are routines or models that come with 3rd-party libraries that have been installed and configured in the front office. Examples are SABR, Black-Scholes and the Hull-White interest rate model. The primary purpose of front office quantitative models is the calculation of fair values (also known as mark-to-market values (MTMs), or present values (PVs)) for the bank’s held-for-trading positions. Daily P&L is in turn derived from the daily changes in these fair values.
Finance and Risk Modeling Ecosystems. The control regulatory calculations used by Finance and Risk modeling ecosystems are a separate set of calculations that typically sit downstream of front office quantitative calculations. Control and regulatory calculations use both the outputs generated by front office calculations (fair values, risk sensitivities, calibrated market parameters) and other inputs (market data, static data, position data) in order to compute the required calculations. Expected Shortfall, the aggregation of risk sensitivities across correlated risk factors, Value-At-Risk, P&L Attribution, Bid-Offer Reserves calculations, CVA, FVA, Market Price Uncertainty, Close-out Costs Uncertainty, and IPV variances are all examples of control and regulatory calculations that are owned typically by either Risk or Finance within the trading firm.
Extra Vigilance Required when Market Volatility is High
Because the inputs into P&L calculations (positions, market data) change so frequently in financial markets, P&L needs to be calculated on a daily basis. If P&L was not calculated daily it would be impossible to attribute the P&L (i.e. to changes in price or changes in position). The primary driver of Daily P&L tends to be market data. It changes day-by-day and often minute-by-minute or second-by-second. Position data on the other hand, tends to change less frequently. It is critical therefore that those changes in market data are verified every day with the appropriate level of governance and sign off.
If position data is held constant, P&L is calculated using the change in market data between yesterday and today. The verification each day of today’s market data is fundamental to the entire process. Most banks/trading firms have an Independent Price Verification (IPV) function. It is the role of IPV to verify that the prices used to calculate today’s P&L are correct. The tools that IPV and P&L teams use in this verification process need to be robust and have a level of sophistication and automation that reduces manual effort while simultaneously ensuring that all market data anomalies are caught early and addressed. Zero checks, stale checks, calendar checks and bid-ask spread checks are all examples of the types of market data validation that need to be performed by IPV, P&L and other market data-focused teams.
In times of high market volatility, two of the more important market data checks that need to be performed are materiality and day-on-day movement checks. The materiality check involves ensuring that the control teams in question are aware of the impact that any mistakes in market data will have on P&L. The concept is illustrated using the diagram below:
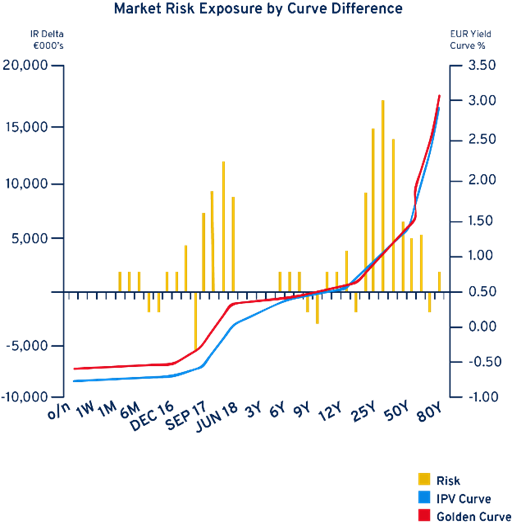
IPV and P&L controllers need to be aware of the trading desk’s exposures when doing their market data checks. In the diagram above, the trading desk has its largest exposures around the 25Y point on the curve (see highest yellow bar). In this example, any market data mistakes made on 25Y rates will lead to very large under or over statements of the daily P&L. This is because a 1bps move at the 25Y point leads to a P&L change of about EUR17 million.
The day-on-day movement check is a standard validation run by most market data teams. It checks that the change in rate or price between yesterday and today is within acceptable upper and lower boundaries. Different types of day-on-day movement checks are possible, e.g:
- Percentage e.g. 3%
- Absolute e.g. 50bps
- Standard Deviation e.g. 1 standard deviation
Of these checks, the Standard Deviation check is the most suitable to the high market volatility conditions we are currently experiencing. Standard Deviation can be thought of as the average daily price movement over a historical period (e.g. 60 days). As market volatility increases so do the daily price movements that are used in the standard deviation calculation. Standard deviation-based day-on-day movement checks therefore automatically widen tolerances (without any user input) as market volatility increases. This is not the case with e.g. the Absolute day-on-day movement check. Without the automatic widening of tolerances, the workload of market data teams will increase significantly in periods of high volatility as the number of exceptions generated by high day-on-day movements will mean longer review times and delays and getting accurate P&L numbers reported.
As you can see, standardizing market data and having market data quality checking tools and algorithms are essential pre-requisites for market data-focused processes such as daily P&L and IPV. The abilities of these systems to both automatically adjust tolerances during periods of high volatility and to provide P&L and IPV controllers with a view of materiality (of P&L impact) will be crucial controls that trading firms use as the industry navigates its way through the current COVID-19 crisis.
Subscribe to our newsletter